Methods
A multitask tool
Open science
French cities / regions
- Albi region
- Alençon St-Lô region
- Amiens region
- Angers region
- Angoulême region
- Annecy region
- Annemasse region
- Bayonne region
- Besançon region
- Béziers region
- Bordeaux region
- Brest region
- Caen region
- Carcassonne region
- Cherbourg region
- Clermont-Ferrand region
- Creil region
- Dijon region
- Douai region
- Dunkerque region
- Grenoble region
- La Réunion
- La Rochelle region
- Le Havre region
- Lille region
- Longwy region
Canadian cities / regions
Latin american cities / regions
Help to use the Mobiliscope
1) Preliminary notes
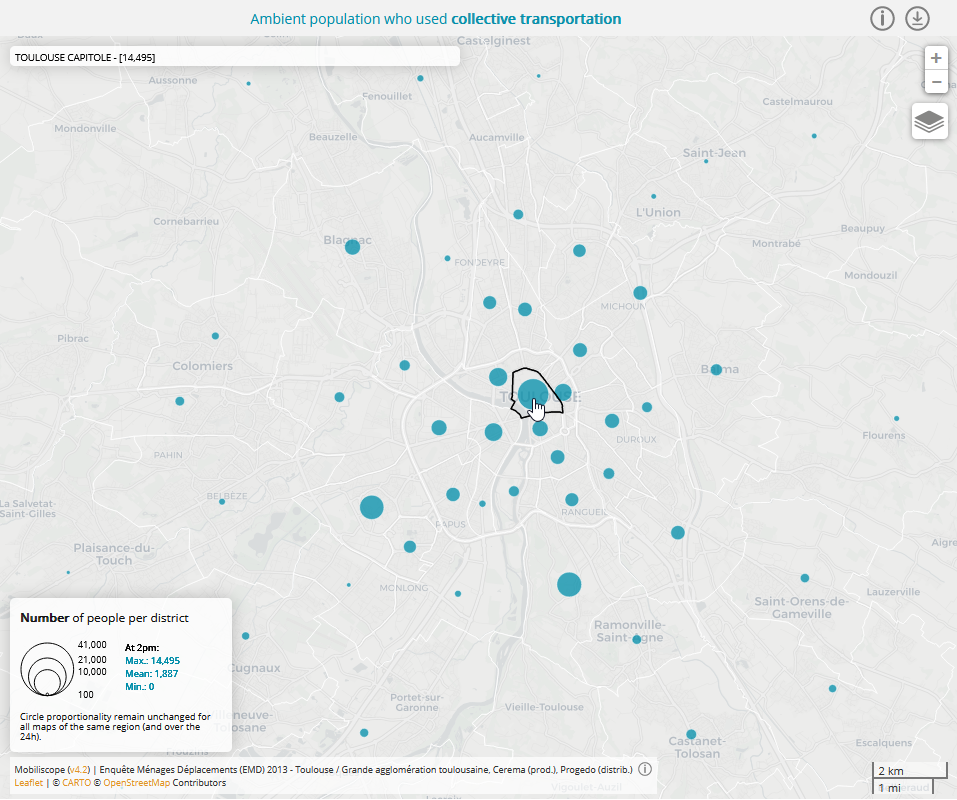
Initial data come from Origin-Destination surveys (from 2009 to 2019). Once transformed, these data have been used to estimate the ambient population in every district at exact hours (04.00, 05.00 etc.) during a typical weekday (Monday-Friday).
Number and proportion of ambient population aggregated by district and hour are estimation : they are subject to statistical margins of error.
58 city regions (spread over 5 countries) are included in the actual version of the Mobiliscope (v4.2).
To choose the city region you want to observe, please selection the city region in the drop-down menu ![]() or use the magnify tool
or use the magnify tool  from a search by name.
2) Select a map
In the left-hand menu, you can choose indicator (classified into broad families such as demographic or social profile) and its map representation - eitheir as aof the total population, or number or flows.
To get informations about indicators, click button on the right side.

With flows maps you get number of non-resident people at district level. With links (displayed on mouseover), you can see their district of residence (not available on touch screens).

3) Change hours
At the top of the screen, click play button in the timeline to animate map and graphics according to the 24 hours of the day.

4) Explore a specific district
Select one district by clicking on the map.
Have a look at the chart entitled "In the selected district" where you can follow hourly variations of ambient population (for each group of the selected indicator) in the district under consideration. Colours have the same colour code than in the indicator menu. Here, last transportation mode used by present population in the selected district was coloured in blue for public transportation, in pink for private motor vehicle and in green for soft mobility.

By clicking on 'Unique' mode, you can limit representation of the hourly variations for only one subgroup :

5) Explore spatial segregation
The block of graphs entitled "In the whole region" displays two segregation indices computed from every district of the region for each hour of the day.
Duncan Index (also called Dissimilarity Index) measures the evenness with which a specific population subgroup is distributed across districts in a whole region. This index score can be interpreted as the percentage of people belonging to the subgroup under consideration that would have to move to achieve an even distribution in the whole region.

The example above displays, hour by hour, the Duncan Index (Paris region - 2010) for to ambient population residing in or outside 'Poverty Areas'. Duncan index range from 0 to 1. A Duncan Segregation Index value of 0 occurs when the share of ambient population residing in 'Poverty Areas' in every district is the same as the share of people residing in 'Poverty Areas' in the whole region. Conversely, a Duncan Segregation Index value of 1 occurs when each district gathers only one of the two population subgroups. In our example, Duncan value is found to be higher between 8pm and 7am, indicating a stronger segregation at night (further away from an even distribution): this corresponds to the hours when most of the individuals are at home or in their district of residence. The value of the index decreases during the day: because of their mobility, people residing in and outside of 'Poverty Areas' are more mixed (situation closer to even distribution).
By clicking on the "Moran" button, a second graph is displayed with the Moran index which measures the similarity in the profiles of the ambient population for neighbouring districts.

The Moran index values vary from -1 to +1: the closer its value is to 1, the more similar the spatially close districts are (with same distribution of the subgroup under consideration); the closer its value is to -1, the more dissimilar the spatially close districts are (with different distribution of the subgroup under consideration). When the Moran index value is 0, no similarity/dissimilarity pattern between neighbouring districts appears in the whole region. In our example, the Moran index values are positive and increase during the day: it means that spatial blocks of similar districts (according to the proportion of inhabitants of 'Poverty Areas') are formed during the day. This result does not contradict Duncan's index but complements it: people residing in 'Poverty Areas' visit during the day other districts than their residential district but tend to visit districts close to each other. And the same is true for people residing outside 'Poverty Areas'
It should be noted that in the case of an indicator subdivided into two groups (eg. male/female or people residing in/outside 'Poverty Areas'), Duncan and Moran values are the same for the two groups and therefore the curves are overlapping.
For more information on the two indices used (Duncan et Moran), click help button next to the index name.
6) Change map backgrounds
By clicking on the  button in the central map, several layers can be displayed to make it easier to find your way around the interactive map: a simple base map (default layer), a more detailed one and aerial photos.


According to the city region under consideration, some other layers can also be displayed such as 'Poverty Areas' in French cities or urban/peripheral rings in Latin American cities.


7) Download data
Data displayed in the Mobiliscope are under open license (ODbL). Mobiliscope data are reusable as they remain under open license and that the sources are mentioned.
By clicking on the  button above the central map, you can download data aggregated data by district and by hour. By clicking on the button in the bottom graph, you can also download data about hourly segregation values (Duncan's or Moran's index) computed for the whole region over the 24 hours period.
To go further
To get more information about indicators and data which are currently used and displayed in the Mobiliscope, you can read Data, Indicators or Geovizualisation pages.
Enjoy!
Version history
Mobiliscope is a constantly evolving tool since the first version went online in 2017.
v1. v2. [2017]
The first two versions concerned only the Paris Region, with an interface in English.
- v1 [May 2017] The first version (only in English) allows to explore the ambient population over 24 hours of the day according to three indicators (total population, level of education and socioprofessional status of the household) with two modes of representation (choropleth maps and proportional symbol maps). The studied population is over 16 years of age. A central map displays the ambient population per districts in the whole city region. A first chart shows the segregation indices (Duncan and Moran) for the whole region, a second chart shows the ambient in the district selected in the map.
- v2 [September 2017] In the second version, six new indicators are included (sex, age, income, occupational status, residential areas and activity). Flows (from residential districts) are added.
v3. [2019-2020]
A bilingual interface (French/English) is proposed. A new indicator for the last mode of transportation is added. New city regions from France but also from Canada are added to increase geographical coverage.
- v3.1. [March 2019] 21 French cities are added. The age of the studied population is now set at 16 years and older. A new indicator for the last mode of transportation is added.
- v3.2. [December 2019] With one more French city region (Nîmes).
- v3.3. [April 2020] 6 Canadian cities are included. In Canadian cities, indicators are slightly less numerous (sex, age, income, occupational status, activity carried out and last mode of transport used) and the age threshold is slightly lower (set at 15 years and older).
v4. [2021-2023]
The fourth version of the tool undergoes a major overhaul of its graphic and cartographic interface. New cities and functionalities are added. District hourly data can be downloaded from the Mobiliscope platform. These open-data are under ODbL license (cf. ici).
-
v4.0 [April 2021]
- Addition of 26 new French cities/regions such as Rouen, Metz, Besançon, Brest, Le Havre, Poitiers and Tours but also the territories of Martinique and La Réunion.
- Open-data. Hourly data of French cities can be downloaded from the Mobiliscope platform.
- Integration of 2 new indicators: (1) residents/non-residents of the area; (2) living (yes/no) in a 'Poverty Areas' (i.e.i> Quartiers Priortaires en Politique de la Ville - QPV). For France only.
- Addition of a new mode of representation (ambient population density - people per km²) is now available for the 'Whole population' indicator.
- OpenStreetMap tiles can be displayed to explore cities more easily.
- Change of threshold values. The threshold previously applied to the maps and charts of the non-resident population (flow mode) has been changed. The threshold of 12 respondents below which no information was displayed (number of non-residents and flows between districts of presence and residence) has been removed. It has been replaced by a threshold of 6 (crude) respondents concerning only flows between districts of presence and residence.
- Additional changes: data for Valenciennes region have been updated from the EMC² 2019 survey ; 18 peripheral districts for the Bordeaux region (2009) have been added ; corrections were made on estimates of the ambient population in Canadian cities; segregation indices for the indicators 'activities' and 'mode of transport' have been deleted.
-
v4.1 [April 2022]
- Addition of 3 new Latin American cities/regions: Bogotá (Colombia), Santiago (Chile) and São Paulo (Brazil), with the addition of specific indicators and associated layers (e.g. indicator on informal work, TransMilenio network in Bogotá)
- Open-data. Hourly data of Canadian and Latin America cities (as well as of French cities) can be downloaded from the Mobiliscope platform.
- Development of the Spanish interface to offer a trilingual interface (French, English, Spanish).
- Integration of an indicator regarding the household composition of respondents for all cities/regions.
- Display of satellite and/or aerial images to help the user find his way around the cities.
- Readjustment of the computation of ambient population across hours. This readjustment induces a shift of one hour in hourly data compared to the data displayed in the previous versions of the tool: ambient population located in a district at a time h was previously counted at h-1.
- Specification of URLs corresponding to displayed geovisualisations. For example, the proportion of women in Bogotá at 8am in the La Candelaria district can now be displayed directly with this URL. Possibility to share specific geovisualisation using the 'Share view' button
 .
. - Improvement of the search tool by municipality/city name : district associated with the searched municipality/city is now automatically selected in the geovisualization (selection of the district in the map and the top chart).
- Modification of the last main mode of transport for Canadian cities: in case of multimodal trips, the last main mode of transport is now defined following this priority order: 1) Collective transportation; 2) Individual motor vehicle and 3) Soft mobility. This priority order is now similar to the one adopted for French and Latin American cities
-
v4.2 [April 2023]
- Extensive reorganisation of the software architecture (web code refactoring) in order to guarantee stability, efficiency and durability of the platform and to facilitate future developments.
- Refactoring of the R code used for data-processing. Data have also been reorganised and simplified.
- For the choropleth maps, modification of the discretization methods now carried out "on the fly" city by city thanks to the geostats.js library. New class boundaries may consequently differ from those of v4.1, in particular for the indicators "Sex", "Area/Residence" and "Activity" whose class boundaries were previously similar for all cities.
- Introduction of stricter rules for the removal of double counts (i.e. respondents counted twice in the same district at a given hour) in order to correct some hourly estimates. These corrections mainly affect Canadian cities, and are very marginally in French and Latin American cities.
- Simplification of map and chart titles.
- Creation of a Zenodo record gathering all the data proposed in open-data in the tool.
IN THE FUTURE...
Further developments are being considered.
- Propose an expert mode for geovisualization
- Integrate data on daily mobility during the Covid pandemic and lockdown periods
- Propose territorial classifications according to districts hourly rhythms
- ...
Join the team !
Contact us if you want to participate to the development of this open-source tool. You are welcome!